- Home
- en
- datalogger-monitoring-systems
- hobo-applications
- hydrology-groundwater-monitoring
Water level recorders track hurricane storm surge in time
Just before Hurricane Rita barreled toward the Louisiana coast in late September, a group of hydrologists from the United States Geological Survey (USGS) in Ruston, Louisiana, had a novel idea for how they might be able to track the levels of storm surge during the hurricane.
The idea was to deploy water level data loggers, normally used to monitor groundwater, in areas along the Louisiana and Texas coasts that were expected to be inundated by the storm surge.

 "For as long as the U.S. Geological Survey (USGS) has existed in Louisiana, we have always tried to document the effects of hurricanes on the Louisiana coast," said Ben McGee, a senior hydrologist with the USGS. "Previously, storm surge data was always generated after the storm. We basically entered a storm-affected area after the fact and looked for high-water marks that indicate storm surge. After Hurricane Katrina, some of us here in Ruston regretted that we couldn't be more proactive in collecting data in the face of major hurricanes. We discussed some ideas and started thinking about using recording devices."
Various federal and private agencies are interested in storm surge level data for a variety of reasons. For example, FEMA has an interest in storm surge elevation data, which is used for flood zone designation and building codes. The U.S. Geological Survey (USGS) has an interest in the data for scientific purposes, such as understanding the effects of storm surge on water quality and ecosystems. The affected states and cities are interested in the data because it affects funding for relief efforts and influences decisions about where to rebuild.
The group's concept quickly became a reality. Within a 72-hour period, McGee and his team received approval and funding from the USGS for the proposed monitoring project, purchased and received 46 HOBO® water level data loggers, and headed to the Louisiana coast, 250 miles away, to put their plan into action.
There, the team spent a stormy, pitch-black night attaching the data loggers to pilings, bridges and other structures along the Louisiana coast that would survive the hurricane.
"Once we identified the equipment we needed, we had to move quickly," McGee explains. "It was September 20, and the hurricane was scheduled to make landfall a few days later. We ordered the data loggers on September 21, and we knew it would take a day to receive them. In the meantime, we built protective housings for all the loggers, put together our sampling plan and worked around the clock to get everything together. On the morning of the 22nd, we left the UPS office on site to pick up the loggers virtually straight off the truck, and at 1pm we left our office in Ruston to drive to the coast."
To determine the monitoring area, the team had analyzed a digital elevation model and marked the areas where the hurricane was expected to make landfall. The monitoring area covered about 4,000 square miles, from the Beaumont/Port Arthur area of Texas to Lafayette, Louisiana. According to McGee, the size of the monitoring area forced the team to find a cost-effective data collection solution that would allow for the greatest number of monitoring points within the given budget.
Although McGee's use of HOBO loggers does not imply approval from the USGS, he describes the decision to use the devices as follows: "To achieve sufficient coverage, we estimated that we needed about 50 monitoring sites. The price of the HOBO loggers was about half the cost of other units we reviewed. They didn't have some of the additional features of some of the other units, but those were features we didn't necessarily need to get the job done. A more expensive solution wouldn't have given us the coverage we felt we needed."

The loggers were set up on laptops running HOBOware® software and programmed to measure and record water levels every 30 seconds around the clock. The protective housings were made from 1.25" O.D. (outside diameter) steel tubing.
Once the loggers were ready for deployment, McGee and others worked through the night to attach the loggers in a storm-proof manner.
"I remember being on Sabine Lake at midnight and Hurricane Rita was several miles offshore," McGee said. "Standing waves of water were being pushed into the lake at 4 to 6 feet per second. It was a very dark night, so we had to work with headlamps. It was a great sight."
It was Friday afternoon before all the loggers were deployed and the team left the area and headed back to Ruston. Hurricane Rita hit the coast early Saturday morning.
"We basically got everything done just in time," McGee said. "It was very intense."
A week later, the recovery of the loggers began. About 80% of the loggers were recovered, and the team is currently in the process of downloading and analyzing the data.
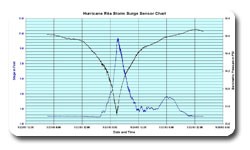
"A database is being built to store all the data collected, and by displaying the data in a chronological sequence, USGS scientists will have a visual picture of the inundation as reported by the loggers," McGee said.

