- Home
- en
- datalogger-monitoring-systems
- hobo-applications
- energy-auditing
- hidden-energy-waste
Detecting hidden energy waste with data loggers -
7 ways to save costs
The key to energy performance is a reliable source of accurate data and analysis. Complex metering systems are often expensive to install, operate and maintain. Data loggers are simple, robust measurement and recording devices that can save companies significant energy costs. The first step to reducing costs is to identify energy waste. Data from monthly utility bills and appliance ratings are useful, but not enough.
Permanent meters are often not an attractive alternative due to high costs and uncertain returns. Simple, temporary devices, such as HOBO® data loggers, can be used to quickly obtain important information at a fraction of the cost. A comprehensive measurement system can be added later if the analysis justifies a larger investment. The information collected by the data loggers can help confirm the need to invest in improvements. Purchasing new energy-saving equipment requires capital, and operational changes can be risky. The savings estimated by analyzing the data collected will help justify these projects. In addition, with data loggers and a comprehensive understanding of utility costs, your facility will be more competitive and have lower fixed costs.
On this page, we'll cover seven common ways to detect hidden energy waste, how to collect and analyze data, and how to calculate savings for each opportunity.
Energy waste 1#: High fixed electricity consumption
Utility bills show electricity consumption over a billing period of about 30 days. This is important information, but only part of the picture. The average electrical load for each demand interval (15, 30 or 60 minutes) is also helpful to understand consumption and uncover opportunities. Below is an example of the consumption interval data.
This information is often available from your local energy supplier. Alternatively, you can use a simple load current data logger to obtain the information. When recording consumption data, measure one phase and make the following assumptions.
- Symmetrical 3-phase circuit
- Nominal mains voltage
- Power factor of 90
- Average active power [kW] = 1.732 x mains voltage x average load current x power factor / 1000
These steps will help to ensure that the demand interval data is accurate enough for energy management:
1. collect data for a complete utility billing cycle and compare the actual energy [kWh] from the utility bill to the logged data. Based on the simplifying assumptions above, a small difference can be expected.
2. calculate a correction factor and use it in subsequent calculations. This will correct for actual grid voltage, phase imbalance, actual power factor and measurement errors.
Fixed use:
The interval data shows that the load of the system has a strong daily profile. While the peak power is 100 kW, the load rarely drops below 25 kW. This is referred to as "fixed load" - the amount of electricity that is always consumed, regardless of the time of day or activity at the facility.
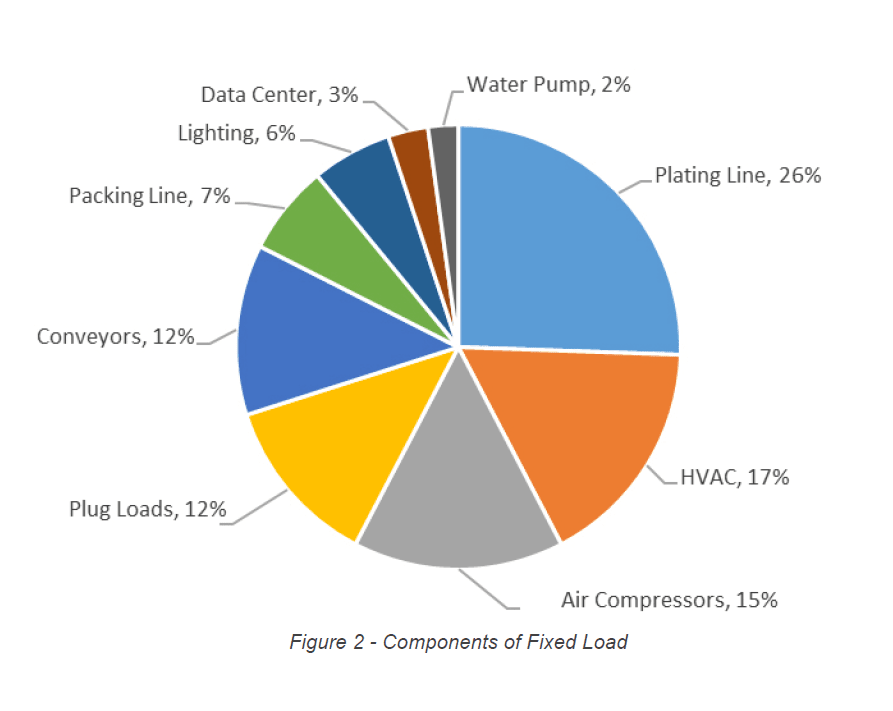
It is important to know the main components of the fixed load - in particular, which appliances are causing this consumption. Using portable data loggers, a chart like the one below can be created to understand the fixed load and identify unnecessary loads that can be turned off instead of running all the time.
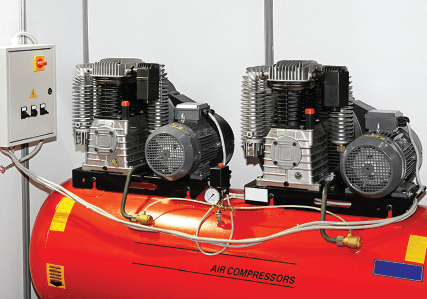
Compressed air is a convenient way to power industrial equipment, and it's useful in many other ways as well. Unfortunately, it is also inefficient and wasteful. Less than 10% of the energy supplied is ever converted into useful work, and 70% of the energy supplied is converted into heat in the compressor.
An important aspect of the compressed air system is compressor control. If you have more than one compressor, it is very important to know how the machines share the load. The air demand in the system changes and rarely matches the rated capacity of all machines, so one or more machines may need to run at less than 100% capacity. Partially loaded compressors are not as efficient as fully loaded machines.
The best way to distribute the load is to run all but one machine, known as the "swing machine", at base load. The swing machine maintains the system pressure by changing the output of the compressor as required. All other machines are operated at constant capacity at maximum efficiency or are idle when not required to meet the load.
Data loggers are used to verify the proper loading of the machine as follows:
1. install a data logger and a current transformer on one phase of each compressor and record the load current for one week with a sampling interval of 30 seconds.
2. calculate the input power of the compressor at each interval assuming a nominal voltage and a power factor of 86% using the formula Input power [kW] = 1.732 x nominal voltage x line current x 0.86 / 1000
3. plot the input power for all machines in a diagram and check that only one machine is operating in the partial load range at any one time. Other important observations - examine the performance profiles of your compressors and take them into account:
1. what does it cost you to run your air compressors in a year?
2. does the compressed air consumption follow the production activity?
3. how much energy (and money) is wasted on compressed air when the system is not in operation?
4. how much of the compressor output do you think is due to leaks in the distribution pipes?
5. what is the value of waste heat and how can it be utilized?
Energy waste #3: Unscheduled operation
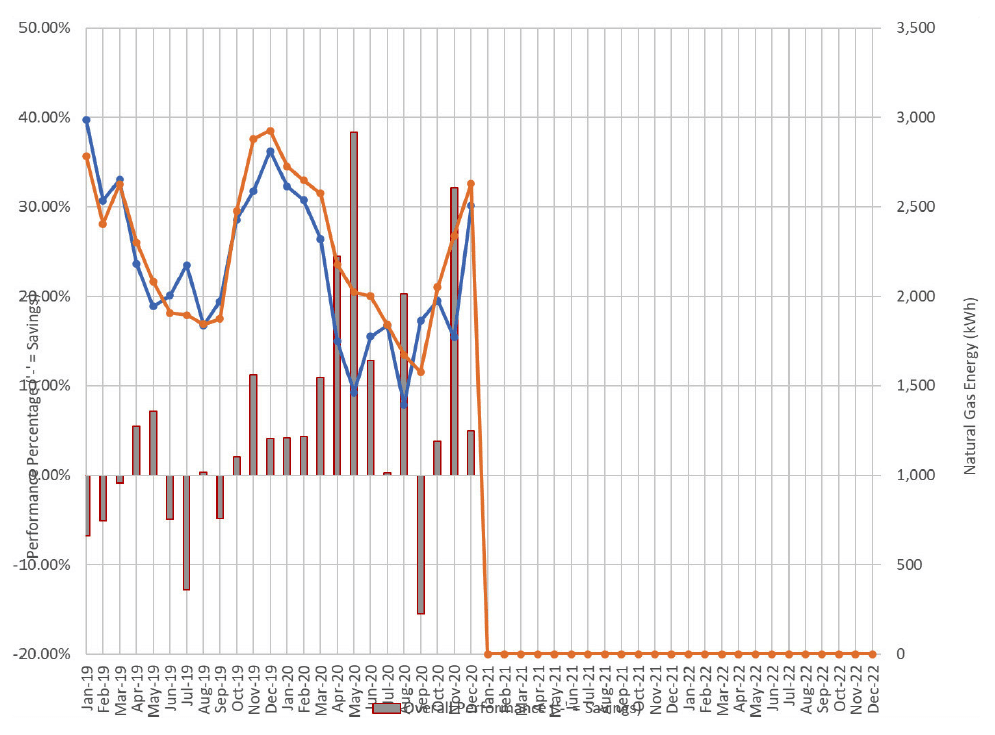
Formal energy management systems have energy performance indicators (EnPIs) that are used to manage energy performance "by exception". They show management how actual energy performance compares to expectations. At the highest level, a monthly EnPI can be "total electricity and gas energy consumed [MWh]". No further action is required if the EnPI is in line with expectations (on the middle line). The total energy is often adjusted to actual weather conditions and production levels to avoid wasting time investigating deviations that can easily be explained by weather conditions or changes in production that month. If the top EnPI deviates from the center line, something is wrong. Management will ask for an explanation and an action plan to bring the plant back to optimal energy standards. In this case, portable data loggers are used on individual pieces of equipment such as large motors, compressors or process equipment to investigate and determine the cause of the problem.
In addition to the process equipment, the investigation should also include the following:
- Air compressors and vacuum pumps
- Air conditioning units, supply air systems and other HVAC equipment
- Large fans and pumps
This is also the time to record and closely analyze the demand interval data for the main power supply.

If you are operating a chilled water system with evaporative cooling, you should analyze the entering condenser water temperature and how it changes with the weather. Portable data loggers can be used to monitor the water temperature along with the ambient temperature and relative humidity. If the entering condenser water temperature remains constant as the weather changes, you are wasting energy because you are operating at a fixed pressure. The condenser temperature has a significant impact on the efficiency of the chiller as it determines the head pressure and compressor capacity. If evaporative cooling is used, the operator should set the condenser inlet temperature to 5 °F above the ambient wet bulb temperature. This will save 2 to 8% of electrical energy if set manually and 4 to 20% if set automatically by an electronic controller. In practice, this means that the water temperature must be lowered as much as possible if the outside air temperature and humidity are given. Lowering the condenser water temperature does require more energy for pumps and fans. However, this additional energy is more than compensated for by the lower pressure and the resulting lower power consumption of the compressor.
Bonus: The suction pressure of the compressor is also an important determinant of energy consumption and efficiency. It is related to the chilled water supply temperature set point. An increase of just 1 °F can significantly reduce energy consumption. A higher chilled water supply temperature may require a higher water flow, but the savings on compressors often make this a good move. Use data loggers to track chilled water supply temperature trends and run the system at the highest level required for cooling.
Note: Be careful when using electrical load current [amps] to estimate actual power [kW].
Electricity is sold in units of real energy [kWh] and power [kW]. You will not find any reference to electrical current or amperes (current flow rate) on your electricity bill. Accurate measurement of AC electrical energy requires measurement of the load current and grid voltage. This must be done in such a way that the phase angle between these two quantities can also be determined. The electricity meters used for billing have this capability.
For energy management studies, we often use a simple current transformer (CT) to measure the load current and assume a nominal voltage and phase angle to estimate the actual power and energy. While these assumptions are valid in many situations, they are not valid in all situations.
The phase angle between current and voltage (power factor) can vary over a wide range for large inductive loads (motors) and capacitive loads (not so common). In these cases, a simple measurement of the load current does not provide accurate information about the actual power and energy consumption.
An example is an induction motor, which may have a power factor of 0.85 at full load and 0.10 or less at start-up. In this case, we cannot assume a constant phase angle (power factor) and a direct measurement of the actual power and energy is required.
A constant power factor is not always a valid assumption - in some cases, such as when starting induction motors, it can be completely wrong.
Energy waste #5: Temporary solutions
Data loggers are often used to significantly reduce energy consumption and costs. Unfortunately, these gains are not always permanent. Within six months to a year, energy consumption returns to higher levels. The cause of this problem is often "temporary" changes that are forgotten and become permanent. You need to make temporary changes to maintain your savings over a longer period of time.
Example
A high-speed machine that applies labels to soup cans is broken. To meet production targets, the machine needs to be back up and running properly as soon as possible. The user believes that increasing the compressed air pressure can help, so the pressure (throughout the system) is increased by 5 psi. Since the problem persists, further changes are made to the lighting, HVAC system, etc., and the machine eventually starts working properly again.
In a typical plant, that's the end of the story; the problem is "solved". In reality, the problem may have been solved in the short term, but the temporary changes are now permanent and have unintended consequences, such as higher operating costs.
To be fair, the floor mechanics did their job, which was to get the machine running. But:
- Did anyone really understand the problem and its causes?
- Were alternative solutions considered?
- Was the best long-term solution implemented?
The answer to all these questions is "probably not".
Recommendations
- Encourage your mechanics to continue to support production and make short-term fixes.
- The same mechanics should be required to report any temporary changes so that a formal problem-solving method can be put in place that leads to the best long-term solution.
- Don't let a series of unreported temporary changes permanently increase your energy costs.

Imagine driving a car from New York to Seattle without a working speedometer. Three weeks after arriving in Seattle, you receive several speeding tickets and a $1,000 fine for speeding in Iowa, South Dakota and Wyoming. The value of a real-time speed display is obvious: you might have been able to avoid the violations, or at least know when and where they were committed. The same is true for commercial and industrial electricity consumers.
Most commercial and industrial electricity tariffs include energy costs
[¢/kWh] and peak demand charges [$/kW]. Many users do not know when the consumption peaks occurred or which electrical loads contributed to the peaks. The average electrical load [kW] recorded every 15 minutes is very useful in reducing peak demand charges.
The data loggers are used to create load profiles as follows:
1. install a data logger and a current transformer on one phase of the facility's power system and set the measurement interval to 1 minute. If the power exceeds 600 amps (maximum size of current transformer available) and there are multiple conductors per phase, place the transformer around one of the conductors and assume that the current is the same in all conductors.
2. calculate the average power over a 15-minute interval assuming nominal voltage and 90% power factor using the expression (power [kW] = 1.732 x nominal grid voltage x grid current x 0.90 / 1000). A spreadsheet program is helpful.
3. examine the profile and look for clear peaks in energy consumption,
as in this example:
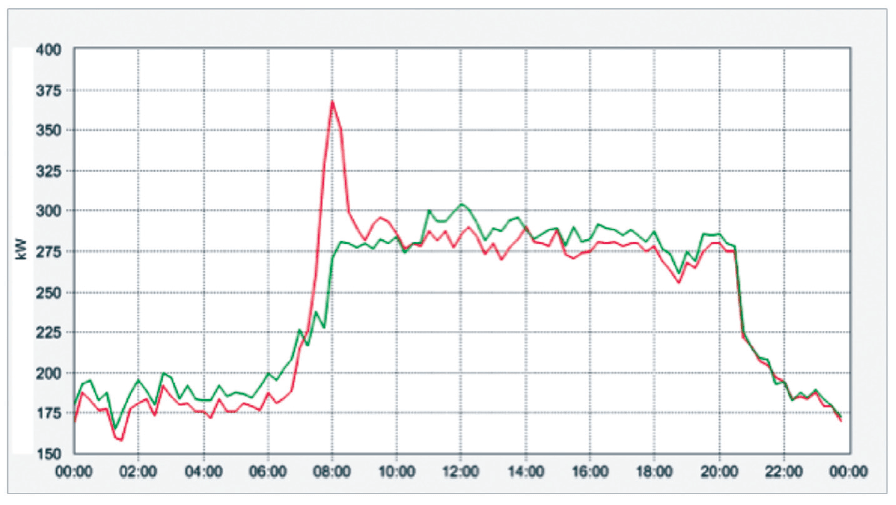
A small grocery store had a peak load of 359 kW every morning at 8:00 am caused by defrosting all freezers at the same time (red line). The green line shows the resulting load profile one week later, after the timers were set to avoid the peak load. The billing demand was reduced from 359 kW to 302 kW, resulting in annual savings of nearly $10,000.
Energy waste #7: Not using "free cooling"
In many facilities, chillers are operated to provide water at a temperature of 40°F to 50°F for production processes and space cooling. This requires refrigeration compressors, evaporators, condensers, cooling towers, pumps and other equipment. The main energy consumer is the refrigeration compressor.
At certain times of the year, it is possible to provide the required chilled water without the compressor if low outside temperatures and/or low humidity allow the heat to be dissipated directly into the environment. This is known as "free cooling" and many facilities do not take advantage of this opportunity to reduce energy costs for cooling by 75%.
Free cooling requires capital equipment such as heat exchangers and controls. However, the savings often justify the investment.
Estimate the potential savings by using a data logger to record the load current on one phase of each chiller compressor every minute for a week. Use the following expression to calculate the hourly electrical energy consumption:
Energy input [kWh] = 1.732 x rated voltage x average load current [amps] x 0.86 / 1000
Estimate the average hourly operating cost [$/hour] using a spreadsheet and the average unit cost of electricity [$/kWh].
Next, pull the weather data and determine how many hours per year the outdoor temperature is below 46°F. This is the number of hours that free cooling may be useful. Estimate the annual value of free cooling by multiplying the hourly operating cost by this number of hours and then by 0.75.
Calculation example
Consider four (4) 500-ton chillers operating year-round in central Nebraska. The average hourly energy input is determined to be 764 kWh based on logged data records. Assuming an electricity cost of 6.3¢/kWh,
the operating cost is $48.13 per hour.
The outdoor temperature is below 46 °F for 3,480 hours per year in central Nebraska. Since free cooling reduces operating costs by 75% (savings of $36.10/hour), the potential savings is $36.10 x 3480 = $126,000.
This is a budget estimate based on one week of operating data and some rough assumptions. Many factors influence the actual savings, so further analysis is required. The purpose of this calculation is to get a sense of the potential benefits so that free cooling can be considered for energy savings.
Benefit from our expertise
Contact us via the channel of your choice and we will advise you on your application and everything you need to know about the right monitoring solution in a no-obligation consultation.
Why not contact us now?
0721 - 62 69 08 50

