Data logger for dissolved oxygen, conductivity, salinity or ph-value
Water quality and water level monitoring can provide data and valuable insights that help scientists and water managers better understand the conditions of water resources. On this page, you will find data loggers for recording conductivity in fresh and salt water, data loggers for dissolved oxygen and data loggers for salt content in fresh and salt water.
- +
Background - Monitoring water quality
Human actions related to growth, urbanization, and industrialization are placing tremendous stress on water resources. Compounding this stress are risks related to climate change and global water scarcity, which further threaten the long-term stability of water supplies. As an important measure to help protect waterways and aquatic ecosystems, water quality and water level monitoring can provide data and valuable insights that help scientists and water managers better understand the conditions of water resources and how those conditions change and are affected by development, agriculture, and other activities. We offer data loggers for all important water parameters such as water temperature, water level, dissolved oxygen, conductivity, salinity, pH and turbidity. This will give you important insights for assessing water pollution and provide data to make informed decisions about water management and conservation. HOBO water quality data loggers are easy to use, provide accurate readings and operate reliably in harsh environments and extreme temperature ranges.
Versatile monitoring solution for water parameters: The HOBO MX800 wireless data loggers
The HOBO MX800 series of wireless multi-parameter data loggers offer a versatile and customizable solution for monitoring conductivity/salinity, temperature, depth and dissolved oxygen in water. Thanks to the interchangeable sensors, these data loggers can be used flexibly. The series comprises two models: the MX801, a fully submersible and easy-to-install model, and the MX802, which enables direct readout without the need to remove the sensors from the water.

Logger for pH values and water temperature - HOBO MX2501
As part of the investigation of water quality, the pH values and water temperatures of rivers, lakes and seas often have to be monitored over a longer period of time. Whether this involves the investigation of coral reefs, fish transportation and sewage channels or the assessment of industrial pollution in open waters, the recording methods must be reliable and accurate. The MX2501 pH data logger was developed for the electronic measurement of water pH and water temperature.
Data logger for pH values and water temperature
The MX2501 pH data logger is a measuring device designed for underwater environments and allows you to accurately measure the pH value and water temperature over a longer period of time. The integrated memory allows you to read out historical data at any time. The robust design is suitable for use in fresh or salt water.
- Transfer the measured values to your mobile device
- Convenient pH calibration via app
- Replaceable battery, pH electrode and anti-biofouling copper protection
- Potentiometric pH electrode with plastic body, gel electrolyte and double fabric connection
Note: An interface is required for configuration and evaluation.

HOBO U26-001 - Dissolved Oxygen Data Logger
The HOBO U26-001 data logger for dissolved oxygen measures oxygen concentrations as well as temperatures in lakes, streams, rivers, estuaries, and coastal waters. with the HOBO U26 Dissolved Oxygen Data Logger. This affordable and precise data logger is recommended for aquatic biology and hydrology research projects. The oxygen logger uses RDO® Basic (Rugged Dissolved Oxygen) Technology to measure dissolved oxygen and is easy to maintain.
Oxygen logger HOBO U26-001:
- Dissolved oxygen (DO) monitoring with 0.2 mg/l accuracy
- Long-lasting calibration with less maintenance
- Easy-to-replace Dissolved Oxygen sensor cap lasts six months
- Automatic correction of measured value drift due to impurities and calculation of salinity-compensated values for oxygen concentration or also percentage values of saturation
- +
Webinar - Monitoring Water Quality with the HOBO U26 Dissolved Oxygen Data Logger
Webinar: Monitoring Water Quality with the HOBO U26 Dissolved Oxygen Data
This one-hour webinar introduces the HOBO U26 Dissolved Oxygen (DO) data logger for affordable, high-performance measurement of dissolved oxygen in water.

- +
Technical Data and Documentations
Technical Data HOBO U26-001:
Monitoring Parameters Dissolved oxygen, temperature Environment Underwater Memory 64KB (21,700 sets of Dissolved Oxygen and temperature measurements) Note: For Dissolved Oxygen measurements in saltwater, an adjustment for salinity is required. For waters with small changes in salinity (<2 ppt), a salinity meter reading typically provides enough accuracy. For environments with greater salinity changes, we generally recommend the HOBO U24-002-C conductivity logger. If you need Dissolved Oxygen in Percent Saturation, barometric pressure data is required, which can be logged with a HOBO Water Level Data Logger (U20-001-04).
Installation instructions sensor replacement kit (U26-RDOB-1)
Software Manual (HOBOware Pro)
Requirements for the operation
- Interface BASE-U-4 or U-DTW-1
- HOBOware Software (Click here for free Software Download)
- USB cabel
- PC, Laptop


HOBO U26-001 data logger for dissolved oxygen
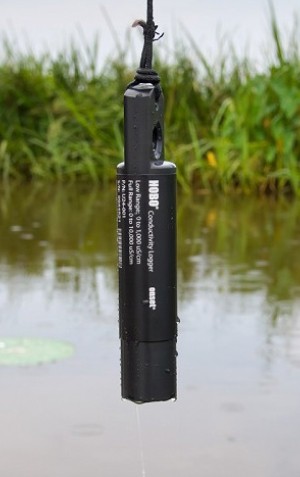
Fresh Water Conductivity Logger - HOBO U24-001 -
This high-accuracy conductivity data logger is a cost-effective way to collect water quality data. It measures and records both conductivity and water temperatures in streams, lakes, and other freshwater sources. This logger is recommended for monitoring aquifers for saltwater intrusion and road and agricultural runoff. Its open access to the sensor simplifies cleaning and maintenance. The HOBO U24’s non-contact sensor minimizes measurement errors related to drift. In addition, the logger features software-based drift compensation.
Hlease note: An interface is required for configuration and reporting

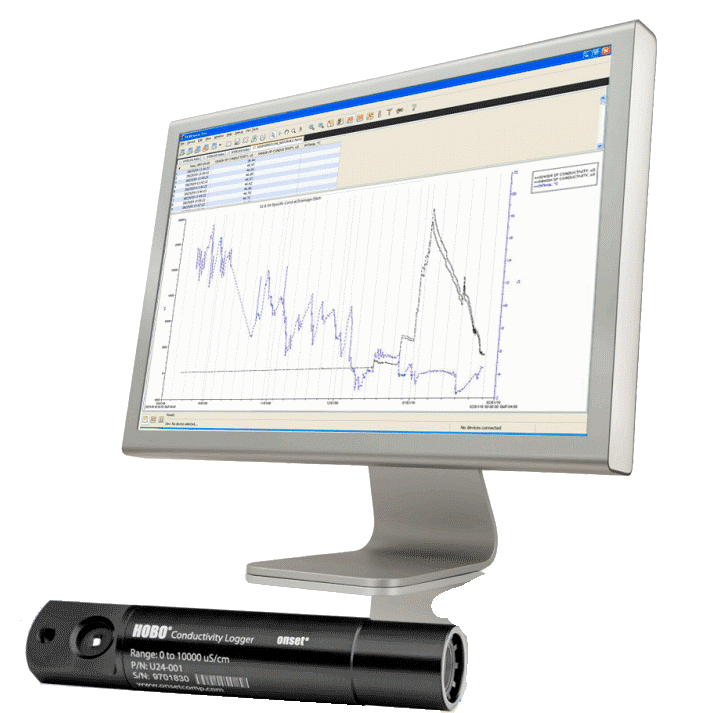
Conductivity Data Logger HOBO U24-001
- Non-contact sensor provides long life and less measurement drift
- Provides easy access to sensor for cleaning and shedding air bubbles
- USB optical interface provides high-speed, reliable data offload in wet environments
- HOBOware Pro software enables start/end-point calibration to compensate for any fouling and provides easy conversion to specific conductance and salinity
- +
Technical Data and Dokumentations
Monitoring Parameters Conductivity/salinity and temperature Environment Outdoor and Underwater Memory 64 KB (18,500 temperature and conductivity measurements when using one conductivity range; 14,400 sets of measurements when using both conductivity ranges) Documentations
Requirements for the operation
- Interface BASE-U-4 or U-DTW-1
- HOBOware Software (Click here for free Software Download)
- USB cabel
- PC, Laptop

HOBO U24-001 Fresh Water Conductivity Data Logger
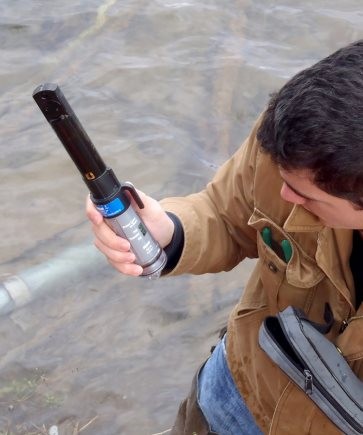
Salt Water Conductivity Logger - HOBO U24-002-C
The HOBO U24-002-C is a cost-effective data logger for measuring salinity, conductivity and temperature in saltwater environments with relatively small changes in salinity (±5,000 μS/cm) such as saltwater bays, or to detect salinity events such as upwelling, rainstorm, and discharge events. It can also be used to gather salinity data for salinity compensation of HOBO U26 Dissolved Oxygen logger data.
Please note: An interface is required for configuration and reporting
Conductivity Data Logger HOBO U24-002-C
- Non-contact sensor provides long life
- Provides easy access to sensor for cleaning and shedding air bubbles
- Two user-selectable ranges provide measurements from 100 to 55,000 µS/cm.
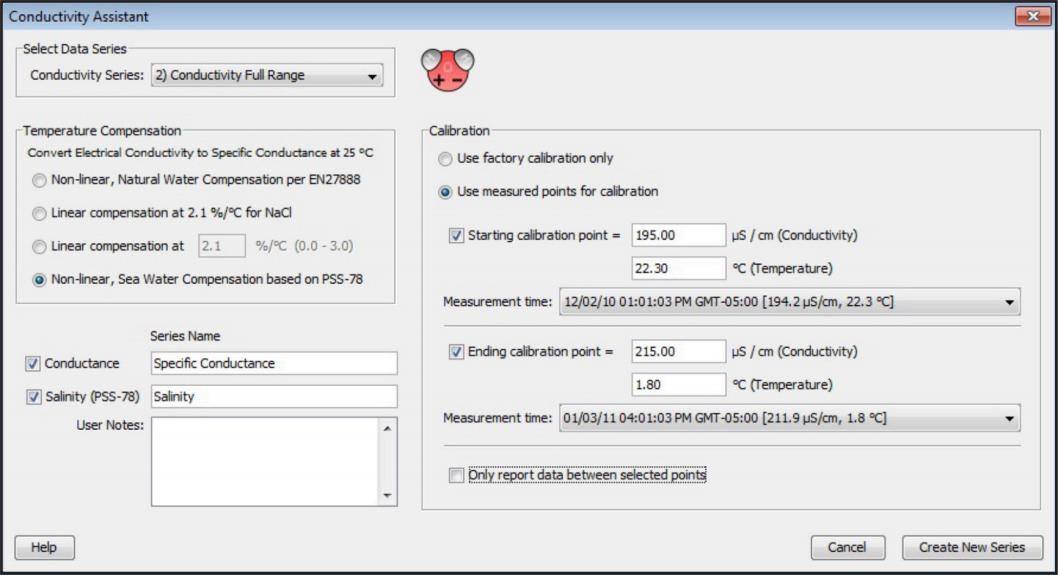
- HOBOware Pro software enables start/end-point calibration to compensate for any fouling and provides easy conversion to specific conductance and salinity using the Practical Salinity Scale 1978 (PSS-78)
- USB optical interface provides high-speed, reliable salinity data offload in wet environments
- +
Technical Data and Documentations
Technical Data HOBO U24-002-C
Monitoring Parameters Conductivity/salinity and temperature Environment Outdoor and Underwater Memory 64 KB (18,500 temperature and conductivity measurements when using one conductivity range; 14,400 sets of measurements when using both conductivity ranges) Note: When monitoring salinity in waters with more than ±5,000 µS/cm variation, refer to the accuracy shown in Plot C in the product manual to determine if the accuracy is acceptable for your needs. Monthly field calibration readings are typically required to achieve the best accuracy.
DocumentationsCalculating Specific Conductance with Sea Water
Requirements for the operation
- Interface BASE-U-4 or U-DTW-1
- HOBOware Software (Click here for free Software Download)
- USB cabel
- PC, Laptop

HOBO U24-002-C Data Logger for Salt Water Conductivity
Universal Optic Base station - BASE-U-4
The Universal Optic USB Base Station and couplers are used to offload data from any HOBO® data logger with an Optic USB interface. The splash-resistant Optic USB Base Station connects to your computer via USB, while connecting to the data logger via an appropriate coupler. The base station is compatible with the HOBO UA, U20, U22, U23, UTBI, U24 & U26 series.

HOBO BASE-U-4
HOBO Waterproof Shuttle - HOBO U-DTW-1
The HOBO Waterproof Shuttle provides convenient readout and relaunching of underwater and outdoor HOBO data loggers with an Optic USB interface, and is waterproof to 20m. The HOBO Waterproof Shuttle can also be used as a base station.
Note 1: Couplers are included for compatibility with our U-series loggers with optical communication, including the UA Pendants, U20 water level, U22 Water Temp Pro, UTBI TidbiT, U23 Pro Temp/RH, U24 Conductivity and U26 DO data loggers.
Note 2: HOBOware Pro is required when using the U-DTW-1 Waterproof shuttle.

HOBO U-DTW-1

Using Water Quality Loggers to Manage Native Fish Habitats
In this 45-minute webinar, Onset's Paul Gannett looks at sites around Cape Cod where water quality data loggers are being used to assess and manage critical fish habitats.
Discover more application examples from our customers:
Contact us
and we will discuss your requirements, costs and everything you want to know in an informal, non-binding meeting.
Why not right now?
0721 - 62 69 08 50
Choosing a conductivity logger
The importance of good water quality cannot be overstated. It is essential not only for the health of the general population but also for the network of ecosystems that it supports. Surface and groundwater contamination is of great concern for biologists, environmental scientists, researchers, and water quality managers who assess the effects of natural and synthetic pollutants on water supplies. Conductivity loggers are ideal for monitoring the impact on water resources from pollutants such as road salt, and agricultural and highway runoff.
1. Measurement range and accuracy
2. Other factors that affect accuracy
3. Ease of deployment and offload
4. Software capabilities
5. Cost of ownership
1. Measurement range and accuracy
The first thing you need to determine is that the conductivity logger’s measurement range will cover the range of conductivity or salinity at your site and that the accuracy is sufficient in that range.- If you are primarily looking to track the occurrence of runoff or upwelling events, accuracy may not be as critical, as long as you can see when the changes occurred. On the other hand, it may be important to know the maximum conductivity or salinity levels during these events, in which case the accuracy of these measurements is significant.
- Tidal estuaries can have an especially wide range, going from freshwater to mostly saltwater.
- Note that conductivity is dependent on temperature, so be sure to look at the conductivity/salinity range for the range of water temperatures you expect. For example, the salinity measurement range is typically wider for colder water temperatures.
2. Other factors that affect accuracy
The accuracy of a conductivity logger is highly dependent on how it is designed to deal with the elements in the environment. Unlike other types of data loggers where absolute accuracy is more easily achieved, conductivity loggers must be able to offset the effects of drift and fouling from algae or sediment buildup on the sensor. How the logger handles these issues is just as important as absolute accuracy. Some questions to ask the manufacturer are:- How prone is the sensor to drift?
There are basically two types of conductivity sensors: non-contact sensors and electrode-based sensors. Most conductivity loggers have electrode-based sensors. Generally, electrode-based sensors are more likely to drift than non-contact sensors because the characteristics of electrodes can change, especially in saltwater. - Does the logger software include compensation for measurement drift from fouling?
Fouling, or the buildup of residue or algae on sensors in a water environment, is an unavoidable reality. This fouling can change conductivity measurements, causing measurement drift. Software with drift compensation allows you to enter a calibration value for both the launch time and the readout time, which accounts for drift over the duration of the entire deployment, rather than the launch time alone, resulting in more accurate data. - How easy is it to clean the sensor of any fouling?
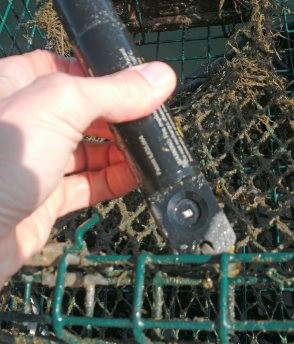
Bio-fouling and excessive marine growth on the logger can compromise accuracy, which means you will need to periodically clean the logger sensor. Conductivity loggers with easily accessible sensors that can be cleaned quickly with a cotton swab are easier to maintain than loggers with sensors obscured behind housing features.
- What are the logger’s temperature accuracy and response time?
Look for a logger with an accuracy of at least 0.1°C and a fast temperature-response time, as precise temperature readings are critical to accurate conductivity measurements. If the logger temperature reading is not accurate or has a slow response time, this will result in inaccurate specific conductance readings. For every degree that the temperature is off, the specific conductance reading will be off by 2%. If the response time is slow, then the conductance readings will be erroneous due to thermal lag, the difference between the actual temperature and the current logger temperature reading. Just as important as the response time is that the temperature is measured at the point of the conductivity sensor itself and not at another point inside the logger housing. This ensures that the measurement is truly the temperature of the water and not the temperature within the logger body, which can have a thermal lag and, as a result, a different temperature.
3. Ease of deployment and offload
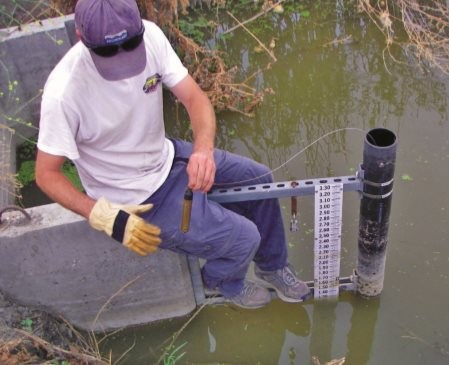
As with all loggers, an important factor when selecting a conductivity logger is how easy it will be to deploy and then subsequently retrieve the data. Specifically, consider the following:- The conductivity logger should be designed to sink, rather than float, so that it reaches the correct depth for the deployment. Some conductivity sensors require that you add weights to make them sink.
- There should be a simple solution for mounting the logger. An eyelet built within the logger body provides an easy way to hang the logger in a well or attach it to a mounting pole or pipe.
- The smaller the logger, the easier it is to mount and transport to the site. Compact loggers can be deployed in a variety of locations, such as small wells, and are easily hidden and better protected.
- You will need access to the sensor for cleaning and to prevent bubbles from forming. A logger designed for open access to the sensor allows for easier cleaning and better water flow, which in turn provides faster response time and a reduction of air bubbles.
- A data shuttle option provides a convenient way to offload data. Loggers generally provide a way to offload directly to a computer, but this means you either have to bring a laptop to the field or you need to remove the logger from the deployment site and bring it back to the office. With a waterproof data shuttle, you can bring it to the field, quickly connect it to the logger, offload the data, and re-launch the logger right away. You can leave the logger at the deployment site and bring the shuttle back to the office instead.
- When you do want to connect the logger directly to a computer, you’ll want it to connect via a USB port, which allows you to offload data more quickly than a logger requiring a serial port. In addition, loggers that rely on mechanical plug-in connectors can be damaged by water in the field and cause failures. A conductivity logger with an optical interface that is sealed within the logger housing eliminates the possibility of water-related damage and/or failures.
Deployment Best Practice
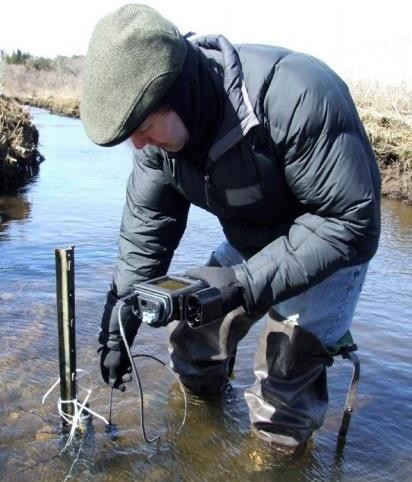
Once you have selected a conductivity logger, there are several things to consider regarding the actual deployment:- You should have a field calibration meter to periodically take calibration readings.
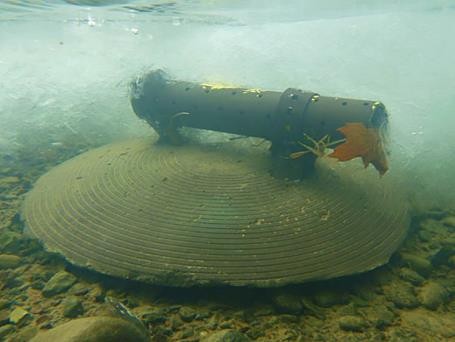
- The logger should be placed in a location that has good continuous water flow, if possible. Use a PVC pipe with holes to protect the logger in high-flow environments.
- You will need to mount the logger so that the sensor will shed air bubbles, as air bubbles on a sensor can cause significant measurement error.
- Keep the logger at least an inch from metal surfaces. The distance becomes more important the lower the conductivity is.
- Mount the logger in such a way that you can obtain access to the sensor for cleaning with a cotton swab and mild detergent whenever possible – particularly in fouling environments.
4. Software capabilities
When considering which conductivity logger is best for you, it is also important to evaluate the software that accompanies it. The software, in general, should be highly intuitive so that you can quickly become proficient in configuring parameters, launching the logger, and offloading data. There are several specific features that you should look for in a software package:- Conversion capability – The software should be able to easily convert conductivity data to specific conductance at 25°C and/or salinity. It should also provide a range of options for entering your own coefficients and provide the EN 27888 and ISO 7888 standard conversions for natural water.
- Calibration point handling – There should be a clear, simple way to enter calibration points gathered at the beginning of the launch and at the end when you offload the data, in order to compensate for measurement drift.
- Multi-logger graphing – Viewing and analyzing data from multiple loggers on a single graph is a very useful feature, whether you want to analyze several loggers from the same area or across multiple sites. The software should be able to combine data from multiple loggers in one plot.
- Easy data export – Conductivity data often needs to be incorporated into other software programs, such as spreadsheets or modelling programs. The software should provide a quick way to export the data and save it in several different file types. You should also be able to copy and paste graph images into other programs for generating reports.
- Project save and recall – The software package should allow you to save any changes you make to the graph, preserving plot setup details for future use. While the ability to save your project seems like a basic feature, some software packages do not have this capability.
5. Cost of ownership
As with any purchase, an important consideration is how much will the logger cost. Conductivity loggers are becoming increasingly less expensive, with some below 800€. However, the cost of ownership does not pertain just to the actual purchase price of the logger, but also to its time- and hence money-saving features.- A logger that can compensate for drift means you don't have to go out to the logger and offload data or get calibration readings as often.
- A logger that is easy to clean will also save time, as will a logger build with durable materials that can stand up to the elements and not need to be replaced
- If you can offload data with a shuttle, then you save a considerable amount of time that would normally be spent either bringing the laptop to the field or taking the logger back to the office and then redeploying later.
Conclusion:
- As the demand for water conductivity monitoring grows, so too will the need for instruments that make the process faster, cheaper, and more accurate. Underwater data loggers are the instruments of choice among researchers and resource managers because of their 24/7 operation, high accuracy, ease-of-use, and computer-based analysis and reporting capabilities.
These pages may also interest you